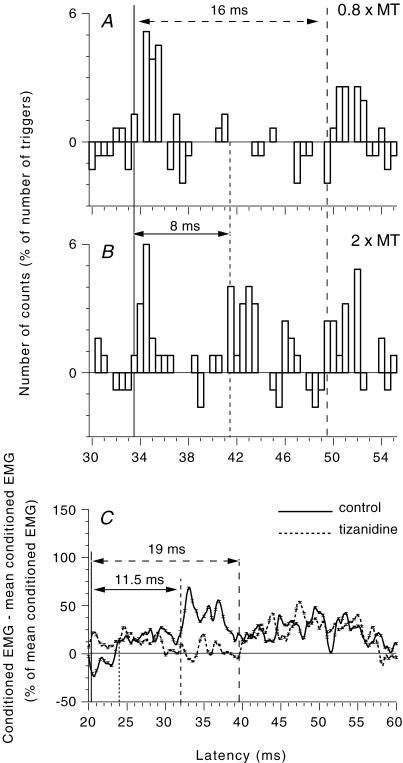
Figure 7. Evidence for a long-latency group I excitation in healthy subjects.
A and B, PSTHs for a FDS unit (the background firing has been subtracted). Effects of ulnar nerve stimulation at 0.8 (A) and 2 (B) × MT. (Calculations for heteronymous monosynaptic latency: median – induced monosynaptic latency, 29 ms; distance wrist–elbow, 0.28 m; supplementary afferent conduction time for the ulnar Ia volley, 4 (0.28/69) ms; ulnar-induced heteronymous Ia excitation expected at 33 (29 + 4) ms, compatible with the latency (33.5 ms) of the early peak in A and B). C, modulation of the ongoing rectified FCR EMG (tonic voluntary contraction of ∼10–20% of MVC) after ulnar nerve stimulation at wrist level (2 × MT) in another healthy subject before (continuous line) and 90 min after oral intake (150 μg kg−1) of tizanidine (dashed line). (Calculations for heteronymous monosynaptic latency: median – induced monosynaptic latency, 16.8 ms (H reflex); distance wrist–elbow, 0.26 m; supplementary afferent conduction time for the ulnar Ia volley, 3.7 (0.26/69) ms; ulnar-induced heteronymous Ia excitation expected at 20.5 (16.8 + 3.7) ms). Vertical lines indicate the latency of heteronymous Ia excitation (thick continuous line), non-monosynaptic propriospinally mediated group I excitation (dotted line), late high-threshold excitation (dashed line) and long-latency group I (probably transcortical) excitation (interrupted line with large gaps). Horizontal double-headed arrows indicate the time interval between monosynaptic latency and late group II excitation (continuous line) or transcortical group I excitation (interrupted line).

