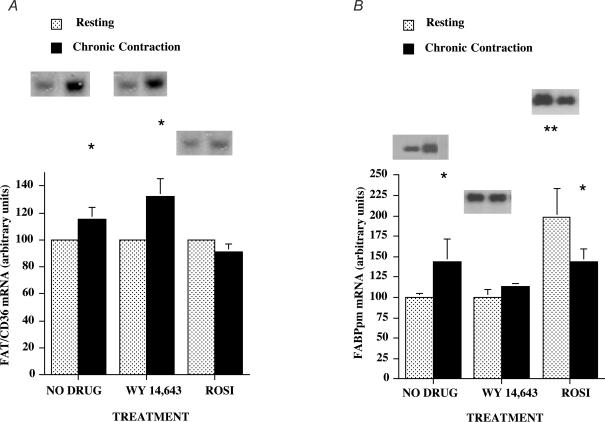
Figure 2. FAT/CD36 mRNA (A) and FABPpm mRNA (B) in resting and chronically contracting muscles treated with the PPARα activator Wy 14,643 and the PPARγ activator rosiglitazone.
Data are means ± s.e.m. In each treatment group, data from day 5 and day 7 were pooled and mRNA data were normalized to 285 ribosomal RNA. n = 6–8 muscles for each group. *P < 0.05, resting muscle versus chronically contracting muscle. **P < 0.05, resting muscle + rosiglitazone versus resting muscle no drug, and resting muscle + Wy 14,643.

