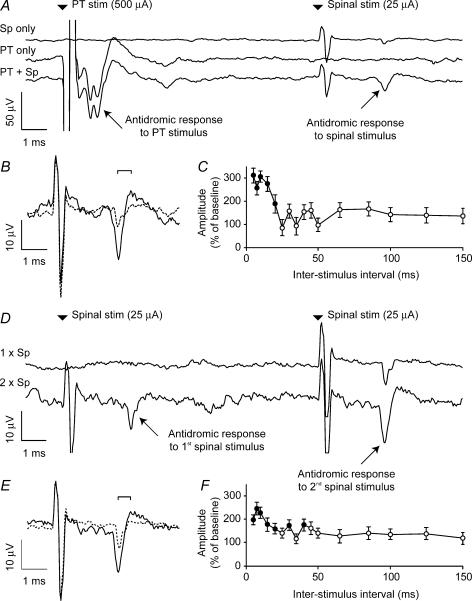
Figure 2. Conditioning of antidromic cortical potential evoked by spinal stimulation.
A, the three traces show averaged responses to spinal stimulation at 25 μA, PT stimulation at 500 μA, and spinal stimulation preceded by PT stimulation with an interstimulus interval of 10 ms. B, expanded plot comparing the response to spinal stimulation alone (dashed line) with the facilitated response following PT conditioning (continuous line). C, peak-to-peak amplitude of response (measured for times bracketed in B) following conditioning stimuli at different interstimulus intervals expressed as a percentage of the unconditioned response. Filled circles indicate intervals at which the conditioned response was significantly modulated (P < 0.05, two-tailed t test). D, average response to single and paired spinal stimulation at 25 μA. E, expanded plot of the enhanced response to the second of a pair of spinal stimuli separated by 10 ms (continuous line) relative to the response to a single stimulus (dashed line). Unconditioned response shows the average of 120 sweeps, conditioned response is the average of 40 sweeps per interstimulus interval throughout.

