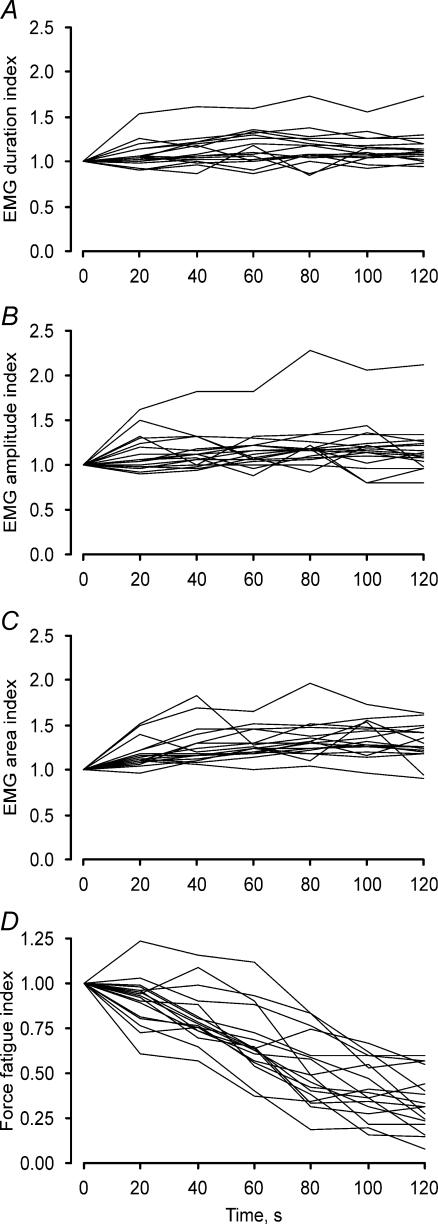
Figure 2. Changes in EMG (first potential in a train) and force with repeated stimulation.
Fatigue indices for EMG duration (A), amplitude (B), area (C) and force (D, n = 17 units). Each line represents data for a single unit, measured every 20 s. Data are expressed relative to the respective parameters at the beginning of the fatigue test.

