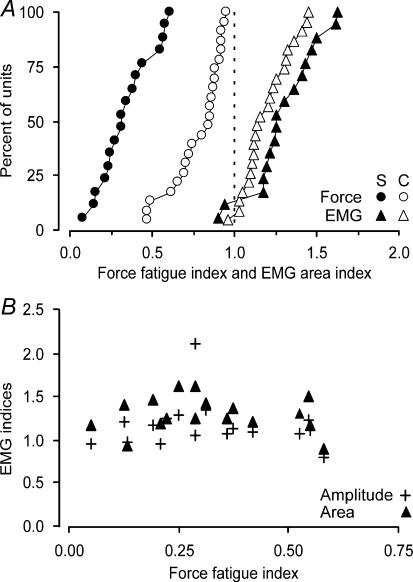
Figure 3. Cumulative distributions of fatigue indices for paralysed and control units.
A, EMG indices (120 s value/0 s value) for area of the first potentials of the trains and the 40 Hz force fatigue indices for 17 paralysed units (S, filled symbols) and 23 units from able-bodied subjects (C, open symbols; Thomas et al. 1991b, 2006). B, relationship between fatigue indices for force and the amplitude and area of the first EMG potentials for all paralysed units.

