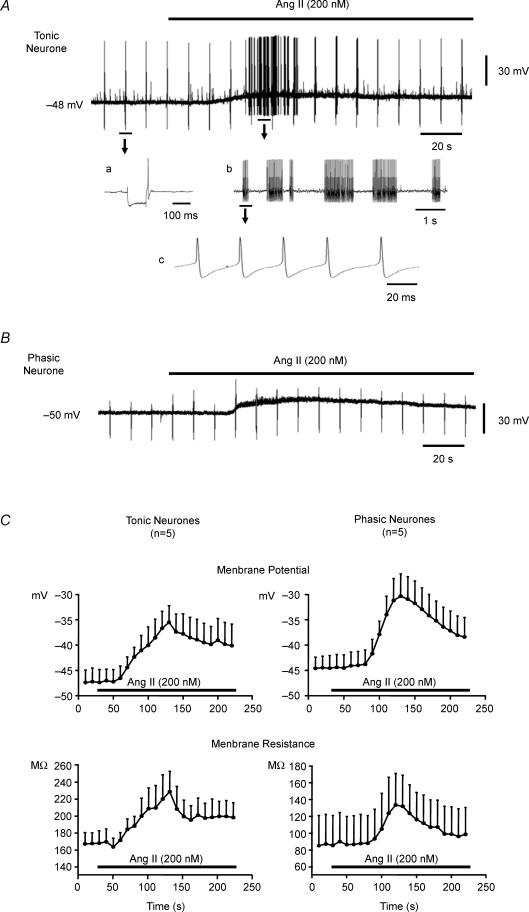
Figure 2. Effects of Ang II on membrane potential and generation of action potentials in tonic and phasic sympathetic neurones.
The resting membrane potential of each neurone is provided to the left of the traces. A, Ang II (200 nm) depolarized and evoked action potential discharge in a tonic neurone. Faster recordings are portrayed in a, b and c. Note that the regularly spaced single spikes present throughout the recording are the result of intermittent brief injections of hyperpolarizing current pulses used to calculate membrane resistance. a, the change in membrane potential induced by a single hyperpolarizing current injection applied to measure membrane resistance. The single action potential following the current injection reflects anodal break and not resting baseline activity. b, the oscillatory nature of Ang II-induced action potential discharge, a section of the trace from A is reproduced at an expanded time scale in the inset. c, to clarify that Ang II-triggered action potentials are of uniform amplitude, a section of the trace from b is reproduced at a further expanded time scale. B, Ang II (200 nm) failed to evoke action potential discharge in the phasic neurone despite a greater depolarization. Note also the absence of anodal break in the phasic neurone compared to the tonic neurone. C, effects of Ang II on membrane potential (top graphs) and membrane resistance (bottom graphs) of tonic and phasic neurones. Superfusion of the neurones with 200 nm Ang II (horizontal bar) depolarized and increased membrane resistance of both tonic (n = 5) and phasic (n = 5) sympathetic neurones. Parallel increases in membrane resistance and decreases in membrane potential (depolarization) were noted peaking at approximately 2 min of infusion and decaying over the subsequent 2 min. Data are expressed as means ± s.e.m.

