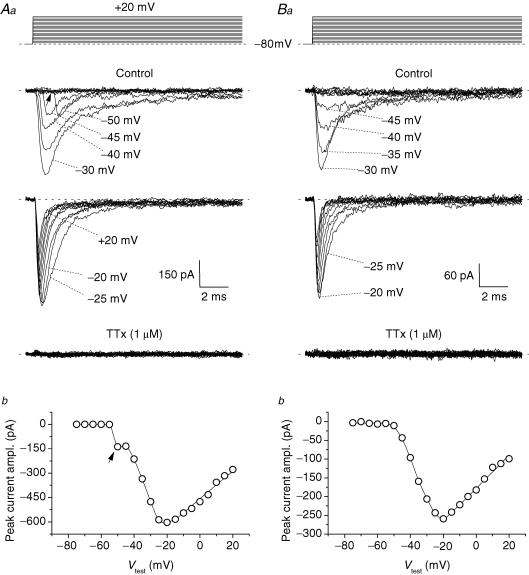
Figure 1. Transient Na+ currents (INaT) in granule cells (GCs) in situ.
A and B, the properties of the INaT recorded in two typical GCs (cell C4120 in A, and cell C4129 in B, representative of 60 and 12 cells, respectively). The voltage-clamp protocol applied to activate INaT is shown in the upper part of Aa and Ba. The middle part of the panels shows the experimental tracings thus obtained in control conditions (the tracings recorded at −75 to −30 mV, and at −25 to +20 mV, have been split in two different subpanels). The lower part of the panels shows the tracings recorded in the presence of 1 μm tetrodotoxin (TTx). Aa, example of the currents recorded in group 1 neurones (see the text), in which an unclamped and a well-clamped INaT component were apparent. The arrow points to the prominent lag preceding the activation of the unclamped component at its threshold. Ba, example of the currents recorded in group 2 neurones (see the text), in which the well-clamped INaT component was observed in isolation. Ab and Bb, current–voltage (I–V) relationships for INaT peak amplitude in the same two cells.

