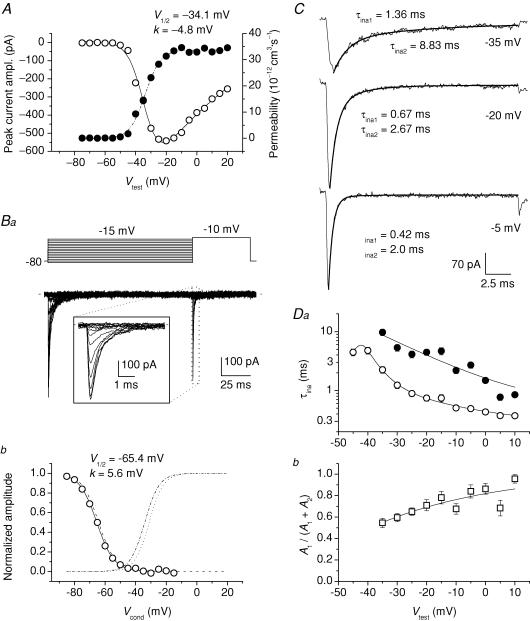
Figure 2. INaT in GCs: voltage dependence of activation, steady-state inactivation, and kinetics.
A, average, normalized (I–V) relationship of INaT in a representative group 2 GC (cell B3512) (^), and the corresponding permeability values (PNaT, calculated as explained in Methods), plotted as a function of test potential, Vtest (•). The PNaT–V plot was best-fitted with a single Boltzmann function (dashed–dotted line): the fitting parameters thus obtained are also specified. The continuous line has been obtained from the same fitting function by converting permeability into current on the basis of the Goldman-Hodgkin-Katz (GHK) equation. Ba, voltage-clamp protocol applied to study INaT steady-state inactivation (top), and the currents thus obtained in the same cell illustrated in A (bottom). The duration of the conditioning prepulse was 125 ms. The inset shows a detail, over an expanded time scale, of the currents elicited by the activating pulse. Bb, plot of voltage dependence of INaT steady-state inactivation for the same cell. The peak amplitude values of the currents elicited by the activating pulse of the protocol illustrated in Ba were normalized for the maximal value observed and plotted as a function of conditioning-prepulse potential, Vcond (^). The continuous line is the best Boltzmann fitting to data points; fitting parameters are also specified. The activation PNaT–V function obtained for this cell, normalized to its asymptotic value, is shown for comparison (dashed–dotted line: same as in A). The dotted line and the dashed line are average activation and steady-state inactivation functions, respectively, constructed as Boltzmann functions in which parameters V½ and k equalled the respective average values (see the text). C, three exemplary INaT tracings recorded at the test potentials of −35, −20 and −5 mV in a representative group 2 GC (cell B4203). The inactivation phase of each current tracing has been best-fitted with a double exponential function (thick lines): the values of the fast and the slow inactivation time constants (τina1 and τina2, respectively) are also specified. D, plots of average INaT inactivation time constants (Da; ^ and •: τina1 and τina2, respectively) and relative amplitude of the fast exponential component (Db) as a function of Vtest (n = 12). Note the logarithmic scale of the y-axis in Da.

