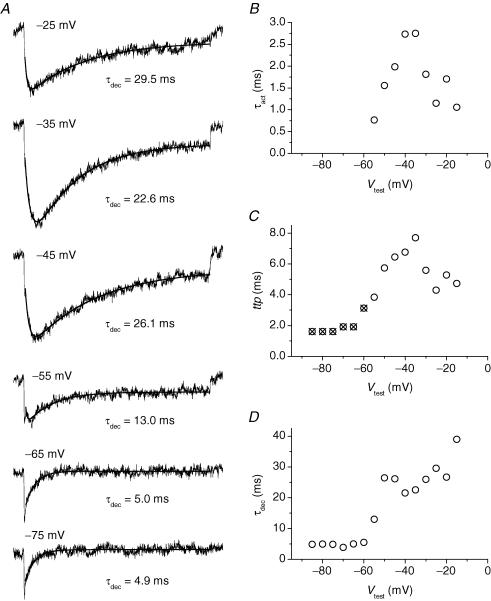
Figure 5. Kinetics of INaR activation and decay in GCs.
A, average INaR tracings at six selected potentials. These tracings are taken from those shown in Fig. 4B (note that here only the tracing region corresponding to the repolarizing pulses is shown; the preceding part of the protocol has been omitted). The repolarization level is specified next to each tracing. Smooth lines are second- (tracings 1–4) or first- (tracings 5 and 6) order exponential fittings to the currents' time course. The time constant of the exponential component describing the current's decay (τdec) is also specified next to each tracing. B, plot of INaR activation time constant (τact) as a function of Vtest. τact values were returned by the fittings illustrated in A, in those cases in which INaR development was separated and distinguishable from INaP tails. C, plot of INaR time-to-peak (ttp) as a function of Vtest. ttp was calculated taking the repolarizing pulse's starting point as time zero. Open circles and crossed circles correspond to ttp values obtained from measurements made in the presence and in the absence, respectively, of a true INaR peak region. In the latter case, the ‘peak’ region to be considered was chosen as illustrated in Fig. 4C (lowermost tracing). D, plot of INaR decay time constant (τdec) as a function of Vtest.

