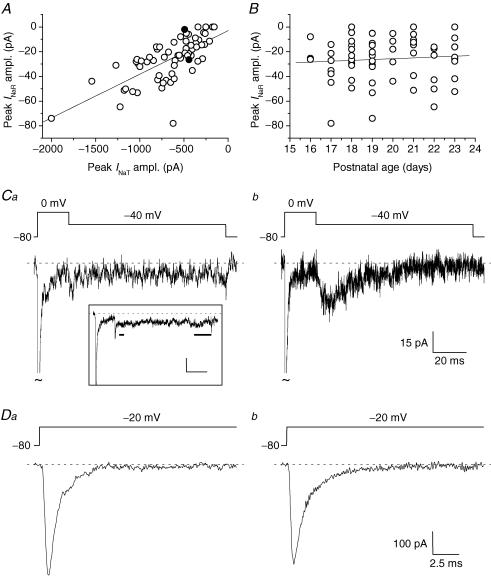
Figure 6. INaR amplitude strongly correlates with INaT amplitude, but INaR expression and amplitude also show intrinsic variability in GCs.
A, scatter plot of INaR amplitude as a function of INaT amplitude. INaR and INaT amplitudes were measured at the peak of the respective I–V relationships (normally −40/−35 mV and −20 mV, respectively). The straight line is the linear regression to data points (slope factor = 35 pA nA−1; R = 0.69, P < 1 × 10⁻⁴). B, scatter plot of INaR amplitude as a function of the postnatal age of the animal (in days after birth). The straight line is the linear regression to data points (slope factor = 0.51 pA day−1; R = 0.062, P = 0.62). Data in A and B are from 67 cells. In both cases, INaR amplitude values are ‘net’ values, calculated as peak current minus Iend (see the text). C and D, INaR and INaT, respectively, recorded, at the peak of the I–V relationships, in two exemplary neurones (Ca and Da, cell B3428, representative of 7 cells; Cb and Db, cell B3327; both cells were classified as group 1 cells). Note the similar size of INaT, the presence of a clear INaR in Cb, and its almost complete absence in Ca. The two cells illustrated here are identified by the two filled symbols in A. Ca, inset, average tracing obtained from 7 cells (four group 1 cells, three group 2 cells) that were judged as devoid of a measurable INaR (same voltage protocol as in the main panel). Note that, at the time point at which an INaR peak would be expected (short horizontal bar), current amplitude was not different from that of the late INaP component (long horizontal bar). In the same 7 cells, the average INaT amplitude at the peak of the I–V relationship was −301.0 ± 47.0 pA. Calibration bars in the inset, 20 ms, 15 pA.

