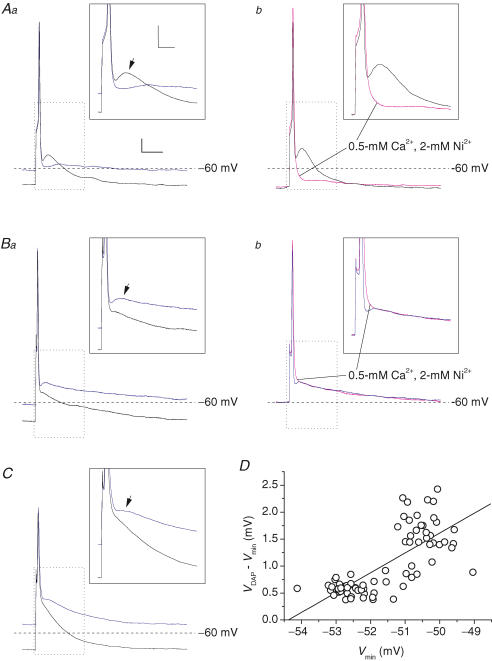
Figure 7. Depolarizing afterpotentials (DAPs) in GCs.
A–C, APs evoked in three typical GCs (A, cell D5518, representative of 2 cells; B, cell A5516, representative of 8 cells; C, cell G100305a, representative of 2 cells) by 500 μs depolarizing square current pulses. Aa, Ba and C show APs recorded in each cell starting from two different baseline voltage levels (Vbas) (−70 mV, black tracings; and −55/−60 mV, blue tracings). Ab and Bb, APs recorded, starting from the same Vbas, under control conditions (black or blue tracings) and during perfusion with a solution containing 0.5 mm Ca2+ and 2 mm Ni2+ (tracings in magenta). Calibration bars: 25 ms, 8 mV. The insets show a detail of the tracings, corresponding to the region delimited by the dotted-line box, of each main panel. The arrows point to the DAPs following single APs. Calibration bars in insets: 10 ms, 10 mV. The amplitude of depolarizing current pulses varied from 0.28 (Aa) to 1.3 nA (C). D, plot of the difference between the absolute voltage level at DAP peak (VDAP) and the level of the relative minimum between the AP and the DAP (Vmin; see the text for details) as a function of Vmin for the same cell illustrated in B. Each point corresponds to the measure made in an individual AP. The straight line is the linear regression to data points (slope coefficient = 0.368 mV mV−1; R = 0.74, P < 1 × 10⁻⁴).

