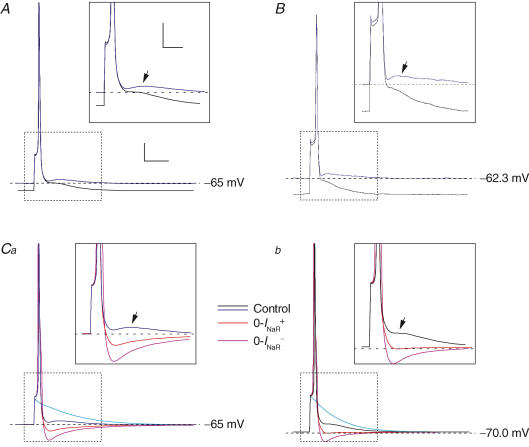
Figure 11. INaR determines DAP generation in model GCs.
Each panel shows single APs evoked by injection of 0.5 ms, above-threshold square current pulses. In all panels, black and blue tracings were obtained, under basal (control) conditions, from a Vbas of −70/−71 mV and −65/−62 mV, respectively. Insets show a detail of the tracings corresponding to the region delimited by the dotted-line box in each main panel, and arrows point to the DAPs that follow APs. A, simulated APs obtained from Vbas of either −70 or −65 mV under basal conditions are shown superimposed. B, single APs and DAPs evoked in a real GC (cell C5518) from Vbas of either ∼−62 or ∼−71 mV: note the similarity with the results of computer simulations (A). C, effect of INaR suppression obtained by adopting the 0-INaR+ condition settings (red tracings) or the 0-INaR− condition settings (violet tracings) at Vbas of −65 (Ca) and −70 mV (Cb). Light blue tracings represent passive responses to just-subthreshold stimuli. The amplitude of depolarizing current pulses was 106–108 pA (Vbas, −65 mV) or 135–137 pA (Vbas, −70 mV) in all simulated experiments. Calibration bars for main panels, 15 ms, 10 mV. Calibration bars for insets, 8 ms, 8 mV.

