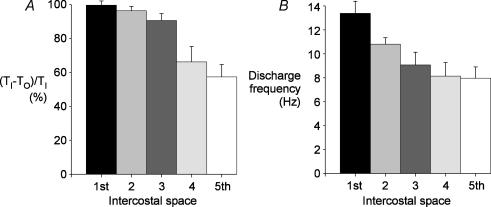
Figure 3. Rostrocaudal gradient of neural drive to the parasternal intercostal muscles.
Data from recordings in the first to the fifth parasternal intercostal spaces close to the sternum for the six subjects. A, the duration of the phasic inspiratory activity is indicated relative to total inspiratory time ((TI−TO)/TI percentage), shown as the mean ± s.e.m. Inspiratory activity in the parasternal intercostals began close to the onset of airflow in the first and second interspaces but was delayed in the more caudal spaces. B, mean peak discharge rates (± s.e.m.) for the group of subjects derived from the inspiratory firing frequency of 79 units in the first interspace, 81 in the second, 80 in the third, 78 in the fourth, and 47 units in the fifth space. The discharge rate was greatest in the parasternal intercostal in the first interspace, and this rate decreased caudally.

