
Figure 3. Leptin induced a decrease in whole-cell input resistance and responsiveness.
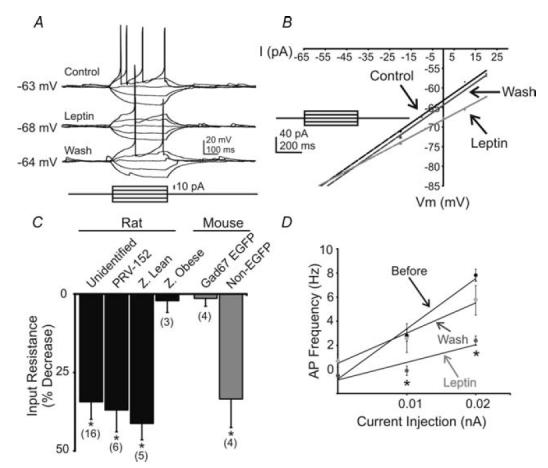
A, current-clamp recording from an unidentified NTS neurone showing a decreased voltage deflection and action potential firing in response to current injection after leptin application (100 nm). B, current versus voltage (I–V) plot from an unidentified NTS neurone illustrating a characteristic decrease in input resistance subsequent to leptin application. Arrows indicate responses before, during and after leptin application. C, plot demonstrating decreases in whole-cell input resistance from the neurone groups examined. Asterisks indicate populations in which a significant reduction in input resistance was observed (P < 0.05). D, current versus frequency (I–F) plot demonstrates the leptin-induced suppression of action potentials in NTS cells that were also hyperpolarized (n = 9).