
Figure 5. Leptin suppressed constant-latency EPSCs evoked after TS stimulation.
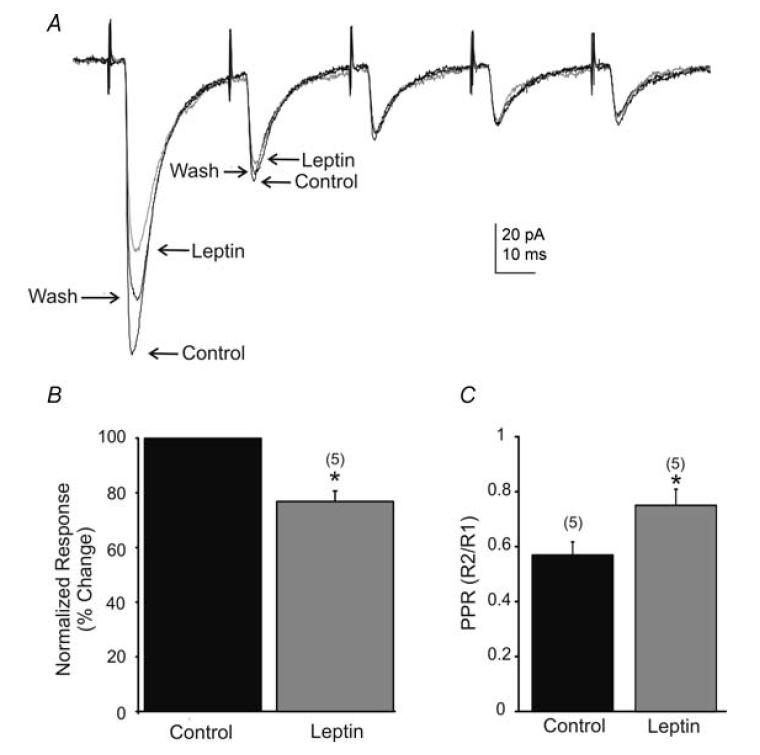
A, traces showing the average response to TS-evoked EPSCs before, during, and 10 min after perfusion of leptin (100 nm; Vm = −65 mV). Pairs of pulses were generated 30 ms (33 Hz) apart, resulting in EPSCs with characteristic paired-pulse depression of the second and subsequent pulses. B, percentage suppression of evoked EPSC amplitude of the first response to TS stimulation. Evoked EPSC amplitude was significantly reduced by leptin. C, shown is a significant increase (asterisks; P < 0.05, t test) in the paired-pulse ratios (PPR) of TS stimulation (numbers of cells are in parentheses).