
Figure 6. Leptin suppressed spontaneous EPSC (sEPSC) frequency.
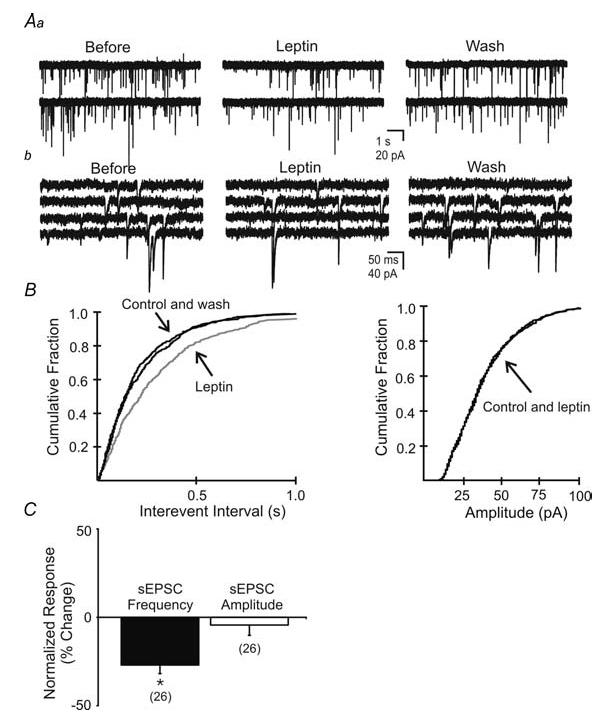
Aa, spontaneous EPSCs recorded in unidentified NTS neurone before, during, and after washout of leptin (100 nm; Vm = −65 mV). b, expanded continuous portions of corresponding traces in A. B, cumulative fraction plot shows a significant decrease in the frequency but not amplitude of spontaneous EPSCs (P < 0.05). C, plots indicating leptin-induced changes in sEPSC frequency and amplitude observed in the neurone population (n = 26). Asterisks indicate significant changes (P < 0.05).