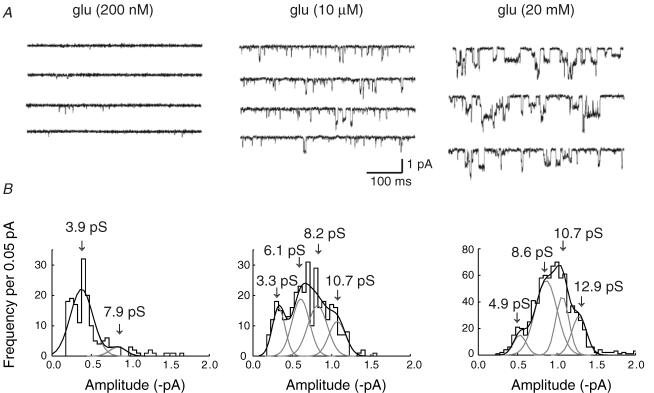
Figure 2. Single-channel events displayed a marked increase in conductance and open time with increasing glutamate concentration.
A, single-channel activity recorded in an outside-out patch exposed to increasing concentrations of glutamate: 200 nm, 10 μm and 10 mm. The frequency of events increased with concentration. Note also the apparent marked increase in amplitude and open time. B, corresponding amplitude histograms of single-channel currents activated by 200 nm, 10 μm and 10 mm glutamate (same patch as in A). Amplitude distributions were fitted with two Gaussian components at 200 nm glutamate, and four Gaussians at higher glutamate concentrations. Arrows indicate mean conductance levels obtained from the fitted Gaussians. Only transitions from the closed state (with openings >1 ms), were included in distributions. Vm = −100 mV; data were low-pass filtered at 1 kHz and digitized at 20 kHz.

