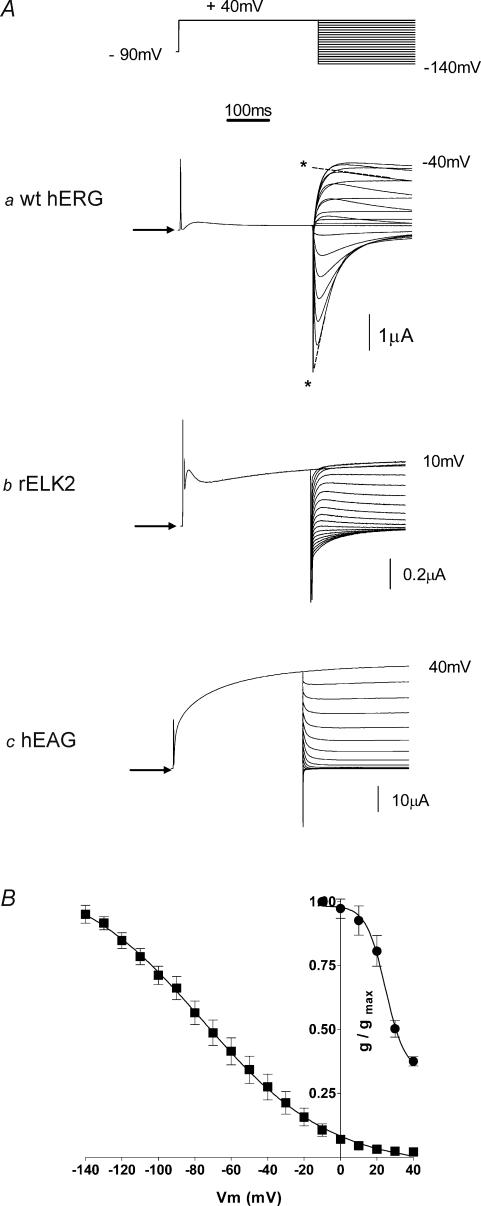
Figure 1. Steady-state inactivation of EAG family channels.
A, typical example of currents recorded from wt hERG (a), wt rELK2 (b) and wt hEAG (c) channels during a two-step voltage protocol (see top trace) to measure steady-state inactivation. Arrows indicate zero current. Single exponential functions were fitted to the deactivation phase of the current traces and extrapolated back to the start of the test pulse to estimate the peak current at each voltage for both wt hERG and rELK2 (see dashed lines and asterisks in a). These data were then used to calculate conductance–voltage curves. B, conductance–voltage curve for wt hERG (▪) and wt rELK2 (•) inactivation. Data points are mean ± s.e.m and the curve fitted to the data is a Boltzmann function (see eqn (1) in the Methods) with a V0.5 of inactivation of −73 mV and slope factor of −29 mV (n = 9) for wt hERG and a V0.5 of 32 mV and a slope factor of −9 mV (n = 5) for wt rELK2.

