
Figure 3. Steady-state inactivation of rELK2/hERG S5P.
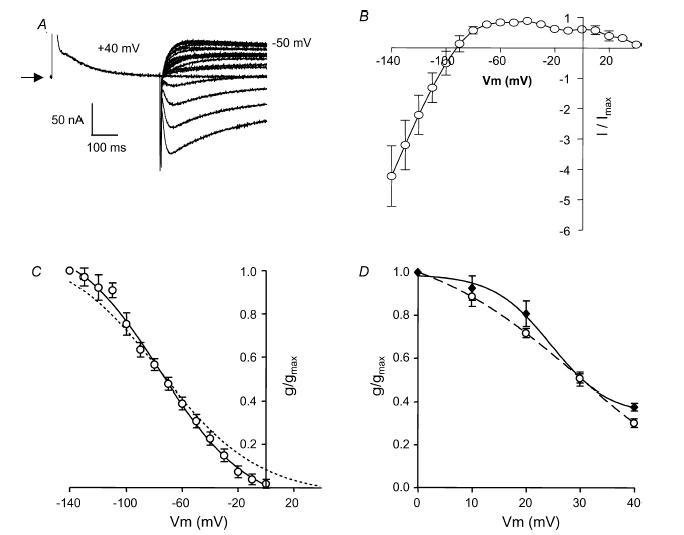
A, typical example of currents recorded from rELK2/hERG S5P channels during a steady-state inactivation voltage protocol (see Fig. 1A). Arrow indicates zero current. B, steady-state inactivation curve for rELK2/hERG S5P indicated the presence of more than one component to inactivation (n = 5); that is the curve appears to be ‘m’-shaped rather than ‘n’-shaped as is the case for wt hERG (see Fig. 6 below). The first component spans the region −140 to ∼0 mV and the second component from 0 to +40 mV C, the conductance–voltage plot of the ‘first component’ of rELK2/hERG S5P inactivation (○) compared to that of wt hERG (dotted line, for data from Fig. 1B). The curve fitted to the data is a Boltzmann function with a V0.5 of inactivation of −80 mV and a slope factor of −23 mV (n = 5). D, the conductance–voltage plot of the ‘second component’ of rELK2/hERG S5P inactivation (open circles) compared to that of wt rELK2 (♦, reproduced from Fig. 1b). The curve fitted to the rELK2/hERG S5P data is a Boltzmann function with a V0.5 of inactivation of 29 mV and slope factor of −9 mV (n = 5).