
Figure 4. Steady-state inactivation of hERG N588E and hERG D591R/Q592R.
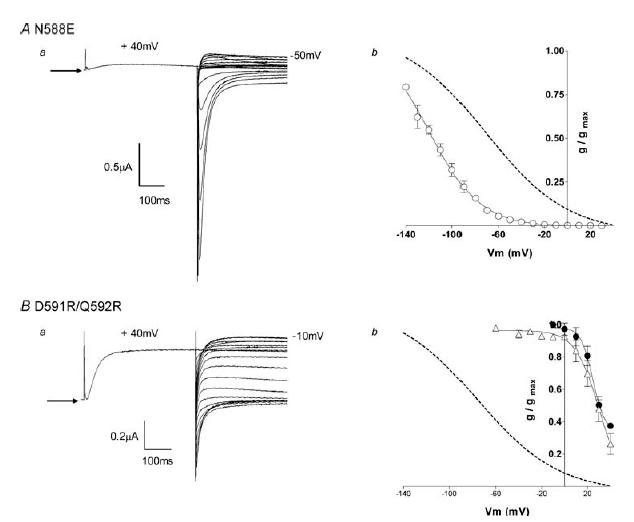
Aa, typical example of currents recorded from hERG N588E channels during a steady-state inactivation voltage protocol (see Fig. 1A). Arrow indicates zero current. Ab, the conductance–voltage plot of hERG N588E (○) compared with wt hERG (dotted line). The curve fitted to the hERG N588E data is a Boltzmann function with a V0.5 of inactivation of −109 mV and slope factor of −17 mV (n = 5). Data for wt hERG (dotted line) are reproduced from Fig. 1B. Ba, typical example of currents recorded from hERG D591R/Q592R channels during a steady-state inactivation voltage protocol (see Fig. 1A). Arrow indicates zero current. Bb, the conductance–voltage plot of D591R/Q592R (▵) compared with wt hERG (dotted line) and wt rELK2 (•). The curve fitted to the hERG D591R/Q592R data is a Boltzmann function with a V0.5 of inactivation of 29 mV and a slope factor of −10 mV (n = 5). The data for wt hERG and wt rELK2 are reproduced from Fig. 1B.