
Figure 5. Steady-state activation for hERG/hEAG/rELK2 chimaeras.
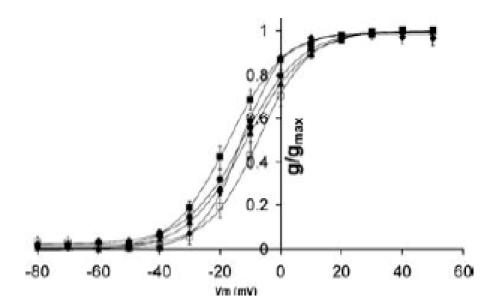
Conductance–voltage curve for wt hERG (▪), hERG/hEAG S5P chimera (▴), hERG/rELK2 S5P chimera (♦), hERG N588E (•) and hERG D591R/Q592R (□) activation. Data points are mean ± s.e.m and the curves fitted to the data are Boltzmann functions. None of the chimaeras caused a significant shift in steady-state activation compared to wt hERG. Full data for V0.5 and slope of the Boltzmann fits are listed in the Supplemental material.