
Figure 7. Steady-state activation for charge scan mutants of hERG S5P α-helix.
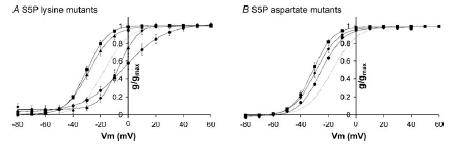
Conductance–voltage curves for charge scan lysine mutants (A) and aspartate mutants (B). Data points are mean ± s.e.m for H587 (▪), N588 (•), D591 (▴) and Q592 (♦) mutants. The dotted line represents wt hERG steady-state activation. Curves fitted to the data are Boltzmann functions. Mutation of S5P hydrophilic residues to lysine or aspartate caused only small shifts in V0.5 of steady-state activation. The largest shifts were observed with the N588K and H587D mutants which shifted steady-state activation +15 and −15 mV, respectively, compared to wt hERG. Full data for V0.5 and slope of the Boltzmann fits are listed in the Supplemental material.