
Figure 1. Effects of E4031 and thiopentone onIKs in a representative myocyte.
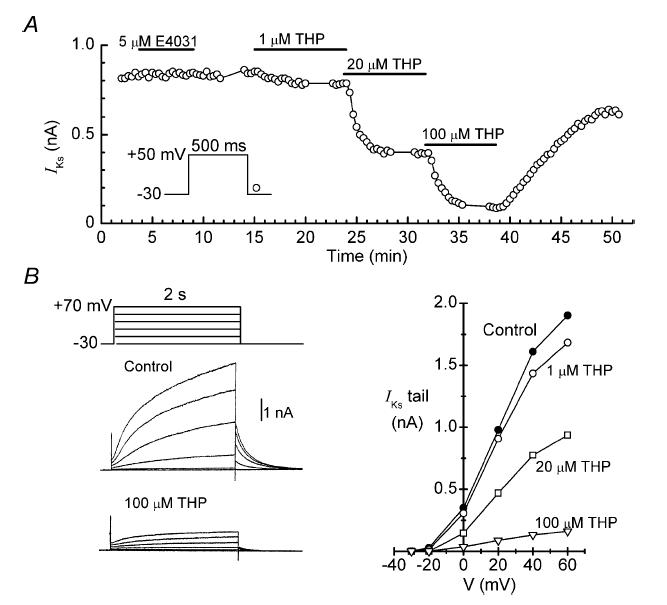
A, time course of changes in the amplitude of the IKs tail during cumulative applications of thiopentone (THP). Time on this and similar plots is referenced to patch-breakthrough time. B, left: two of the sets of current records obtained on the sequences of 2-s depolarizations applied at the times indicated by the data breaks in A. Right: tail current–voltage relationships obtained in this experiment.