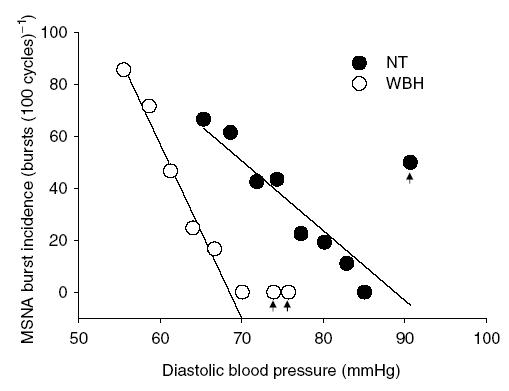
Figure 2.

Slope of the relationship between MSNA burst incidence (bursts (100 cardiac cycles)−1) and diastolic blood pressure (DBP) during normothermic (NT) and whole-body heating (WBH) in one subject. Arrows indicate ‘potential’ outlier data that were included in regression analysis. However, the data points within these bins were 4 of 283 total points for the NT regression and 4 of 383 total points for the WBH regression for this subject.
