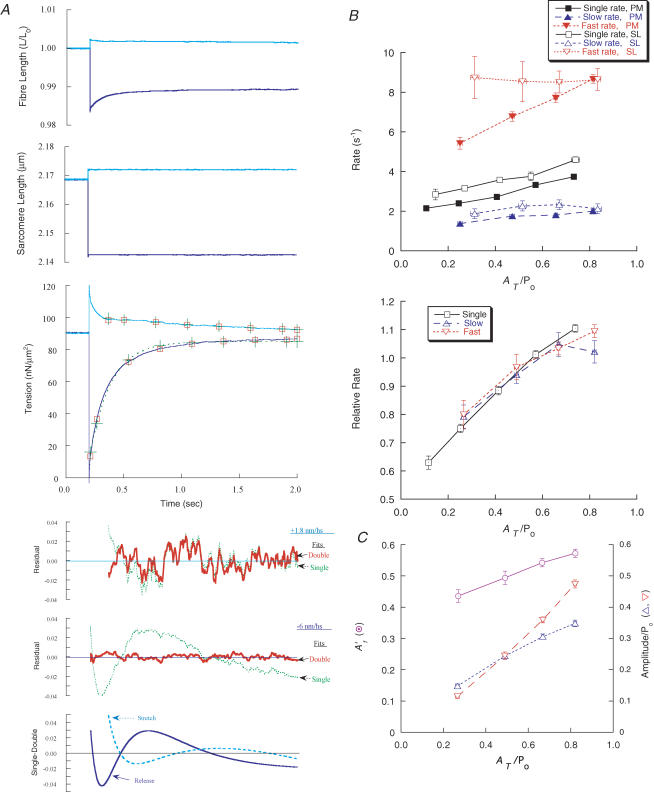
Figure 2. Phase 4 recovery elicited by isometric step length changes.
Step releases and step stretches were applied to an activated fibre in sarcomere length (SL) control. A, records showing fibre length, SL and force for a step release and step stretch. Single- and double-exponential fits (+ and □, respectively) are shown overlaying phase 4 following the release (6 nm hs−1), and phases 3 and 4 following the stretch (1.8 nm hs−1). The single-exponential fit following the release is also indicated by a dashed line (through the + symbols). In the lowest panel, the upper two graphs show the residuals of the fits (dotted lines, single-exponential fits; continuous lines, double-exponential fits). The bottom graph shows differences between the single- and double-exponential fits normalized to recovery magnitude (dashed and continuous lines refer to stretch and release, respectively). The fitted parameters kr1, krs, krf and ks are, respectively, the rate constants of the single, slow rising, fast rising and slowest falling components, and A′f is the amplitude of the fast component after a release relative to total recovery taken from the double-exponential fit. For the release, kr1 = 5.5 s−1, krs = 2.7 s−1, krf = 10.9 s−1 and A′f = 0.58, and for the stretch, kr1 = 0.54 s−1, ks = 1.02 s−1, krf = 9.1 s−1 and the ratio of the amplitudes of the rising to falling components = −0.78. Fibre cross-section (CS) = 5.4 × 103μm2, fibre length = 2.3 mm. B, rate constants as a function of total recovery taken from double-exponential fits. Values are means ± s.e.m. The upper graph shows the absolute rate constants for single- (continuous line) and double- (dashed lines) exponential fits. Symbols: (▪,□) single, (▴,▵) slow, and (▾,▿) fast components; filled and open symbols refer to fibre (PM) and SL (SL) control, respectively. In the lower graph, rates at each magnitude of recovery were normalized to that obtained at a reference magnitude for each fibre; SL and PM data combined. The data from 43 fibres were grouped into categories of recovery magnitude with similar n values (∼50 and ∼15 in PM and SL control, respectively). C, as in panel B, but showing amplitudes of the exponential components (▿, Af/Po and ▵, As/Po) relative to isometric force (Po) plotted against AT/Po. The proportion of phase 4 in the fast component is shown (⊙A′f = Af/(Af + As)). SL and PM data have been combined.

