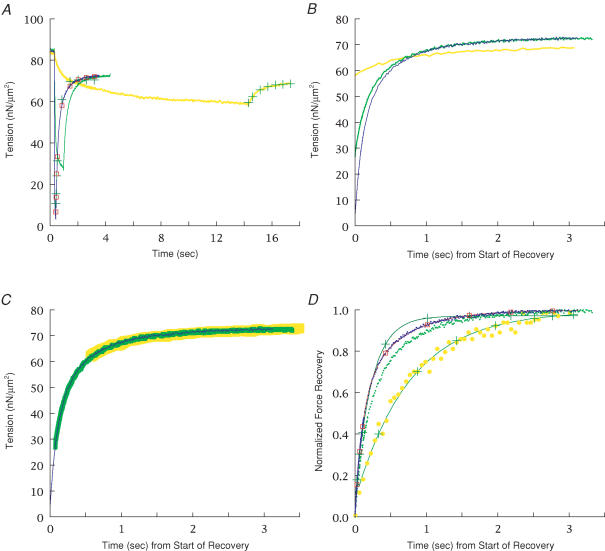
Figure 3. Ramp shortening to a stop.
A, force records showing recovery following ramp shortening to a stop (shortening = 0.63 Lo, 66–97 nm hs−1, PM control) at three velocities: 0.57, 0.10 and 0.0048 Lo s−1 corresponding to ‘low’, ‘intermediate’ and ‘high’ loads, respectively. Single-exponential fits (+) are shown to recovery following the slowest and fastest ramps; a double-exponential (□) was also fitted to recovery following the fastest ramp, but was not obtained for the slowest ramp because recovery in that case was adequately fitted by a single-exponential (see B and C below). The fits to recovery from intermediate load are omitted for clarity. For the fast ramp, kr1 = 4.4 s−1, krs = 1.8 s−1, krf = 9.3 s−1 and A′f = 0.58, and for the slow ramp, kr1 = 1.3 s−1. Initial force shown in the graph was higher than at the end of recovery (Po) due to the longer length before the ramp (2.42 μm versus 2.22–2.28 μm SL, respectively). CS = 4.2 × 103μm2, length = 2.1 mm. B, force records from A shifted so that recovery begins at the same time for all three loads. C, as in B, but with the force records shifted in time so their time courses coincide; a small vertical offset was applied to the force record at high force. D, comparison of force recovery for the three loads plotted with amplitudes normalized to 1.0 and offset to the same start time. Force data are shown as individual points, and fits are shown by continuous lines through the data points with symbols as in A. Recovery at high force was more single exponential in form, as judged by the goodness of fit of a single exponential and the small difference between single- and double-exponential fits.

