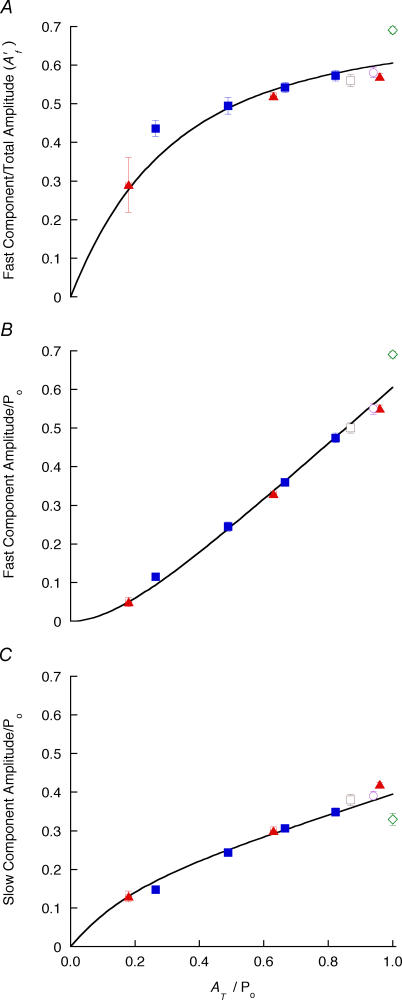
Figure 4. Amplitudes of exponential components versus recovery magnitude.
A, amplitudes for double-exponential fits to recovery after ramp shortening to a stop (▴), slack tests (⋄), step releases (▪), ramp + small stretch (□) and ramp−restretch + step release (○). A, A′f; B and C, amplitudes of fast and slow components, respectively. Continuous lines represent a fitted exponential + line as described in the text. Values are means ± s.e.m.

