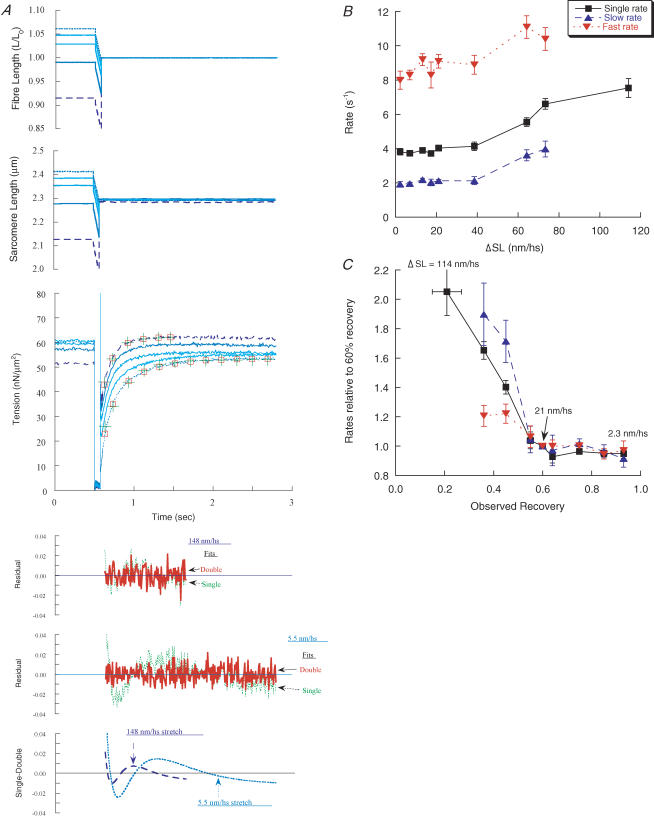
Figure 5. Ramp shortening terminated by step stretches.
A, a series of shortening ramps of constant size and velocity were terminated by step stretches of varying size (5.5, 19, 37, 79 and 148 nm hs−1) as shown in the graphs of fibre length and SL. All of the stretches ended at the same length; the length before the ramp was varied to achieve this and caused a variation in force before the ramp; Po = 56–58 nN μm−2 for the five records. Single- and double-exponential functions fitted to the force traces are shown for recovery resulting from the largest (dashed records) and smallest (dotted records) stretches. Fits and residuals are shown as in Fig. 2A. For the largest stretch (148 nm hs−1), kr1 = 7.6 s−1, krs = 4.8 s−1, krf = 10.8 s−1 and A′f = 0.63; for the smallest stretch (5.5 nm hs−1), kr1 = 3.8 s−1, krs = 2.5 s−1, krf = 10.2 s−1 and A′f = 0.55. CS = 6.2 × 103μm2, length = 2.17 mm. B, the dependence of the rate constants on the size of stretch and magnitude of recovery. Data show single (▪), slow (▴) and fast (▾) exponential rate constants. C, as in B, but the data are normalized within each fibre at a recovery magnitude of 60%Po plotted against observed recovery (force at recovery plateau minus Tmin, divided by Po); change in SL (ΔSL) is taken from the upper graph. It was usually not possible to obtain a double-exponential fit for the largest stretches eliciting the smallest recovery. For the single-exponential fits, n = 5–20 records, and for the double exponentials, n = 5–16 records for each data point; 13 fibres were studied.

