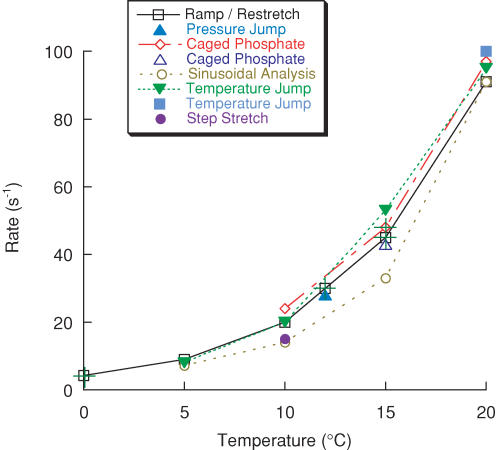
Figure 8. Temperature dependence of related force transients.
The rate constant of the fast component of force recovery elicited by ramp–restretch (□) is compared to force transients elicited by other perturbations over a range of temperatures, including pressure release (‘phase 2’ of Fortune et al. 1994; ▴), caged phosphate (kpi of Dantzig et al. 1992 (⋄) and Walker et al. (1992) (▵)), sinusoidal analysis (‘process b’ of Zhao & Kawai, 1994; ○), temperature jump (‘phase 2’ of Bershitsky & Tsaturyan, 1992 (▪) and τneg−1 of Davis & Rodgers (1995) (▾) and step stretch (‘phase 2b’ of Ranatunga et al. 2002; •). Rate constants shown at more than one temperature are connected by straight lines. Some values have been estimated from Q10 values taken from the data, and these are marked (+). The rate constant of phase 2 of the pressure release response is shown at 12°C (28 s−1, Fortune et al. 1994); the temperature dependence was reported separately (Fortune, 1990), with the Q10 values of their phases 2 and 3 being ∼4.5–5 and ∼2, respectively. The values shown in the graph refer to experiments at low phosphate concentration (∼1 mm). The published temperature-jump data of Davis & Rodgers (1995; τneg−1) were obtained at 15 mm phosphate, and are similar to the rate of force recovery elicited by ramp–restretch at that phosphate concentration (Burton et al. 2005), which is ∼1.9-fold higher than reported here. On the assumption that the two types of force response share the same phosphate dependence, their data have been reduced by the same factor to give the data points shown in the graph. The rate of force recovery following ramp–restretch at 20°C was obtained from fibres rapidly activated by release of ATP from a caged precursor (Sleep et al. 2005).

