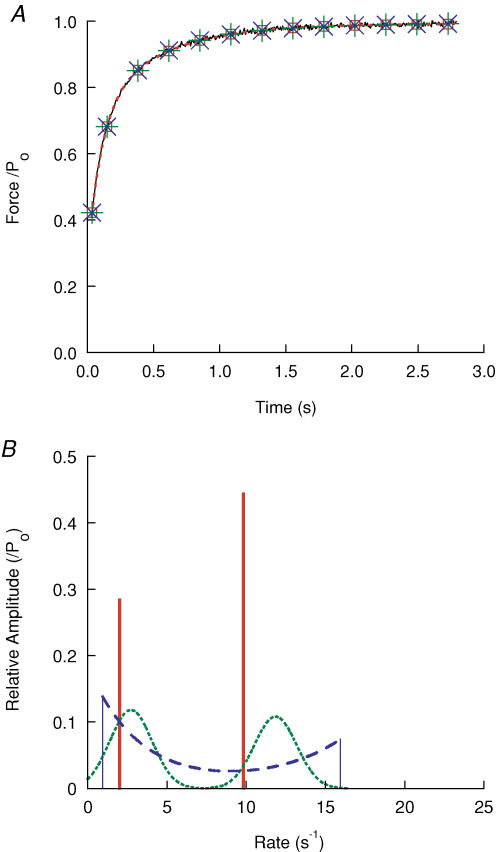
Figure 9. Experimental recovery record fitted with exponential distributions.
A, force recovery following a shortening step of 8.9 nm hs−1 overlaid by two exponentials (□ and dashed line), two Gaussian distributions (+), and bounded distribution of exponentials (×). B, graph of amplitude of component versus rate constant for two Guassian distributions (dotted line), a bounded distribution of exponentials (dashed line and a simple fit of two exponentials (vertical lines).

