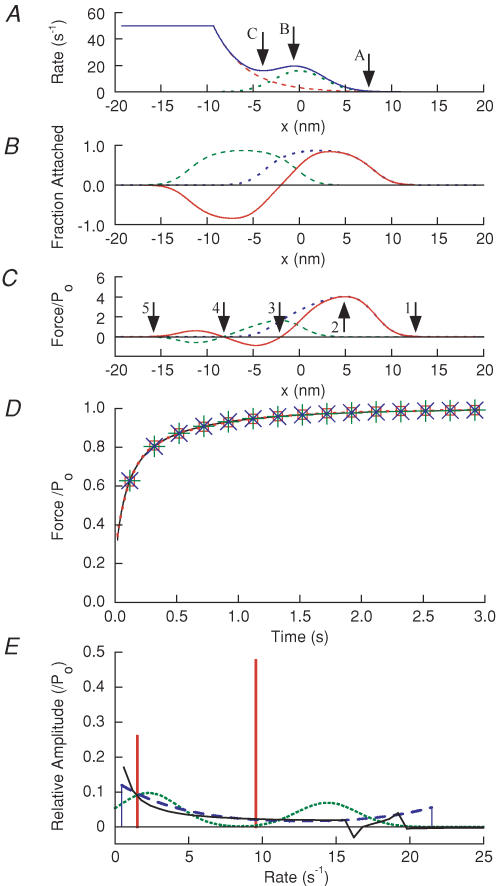
Figure 10. Results of fitting a cross-bridge model recovery record.
The record was a shortening step of 8.25 nm hs−1. A, plot of f (dotted line), g (dashed line) and r ( = f + g; continuous line) versus x. B, distribution of attached cross-bridges P(x) with respect to x, in the isometric state (dotted line), immediately after the step (dashed line) and difference ΔPa between these distributions (continuous line). C, distribution of force F(x) in the isometric state (dotted line), immediately after the step (dashed line) and difference, A(x), between these distributions (continuous line). D force recovery time course calculated from model; symbols as in Fig. 9A. E, amplitude B(r) of exponential components for: model (continuous line), two exponentials (vertical bars), two Gaussian distributions (dotted line) and bounded distribution of exponentials (dashed line). The isometric tension (Po) and stiffness averaged over all cross-bridges were 1.46 pN and 0.14 pN nm−1, respectively. It should be noted that x is the distance between a cross-bridge and the actin site, and is the strain upon attachment; in the model there is an obligatory force-producing step h so the net strain is x + h.

