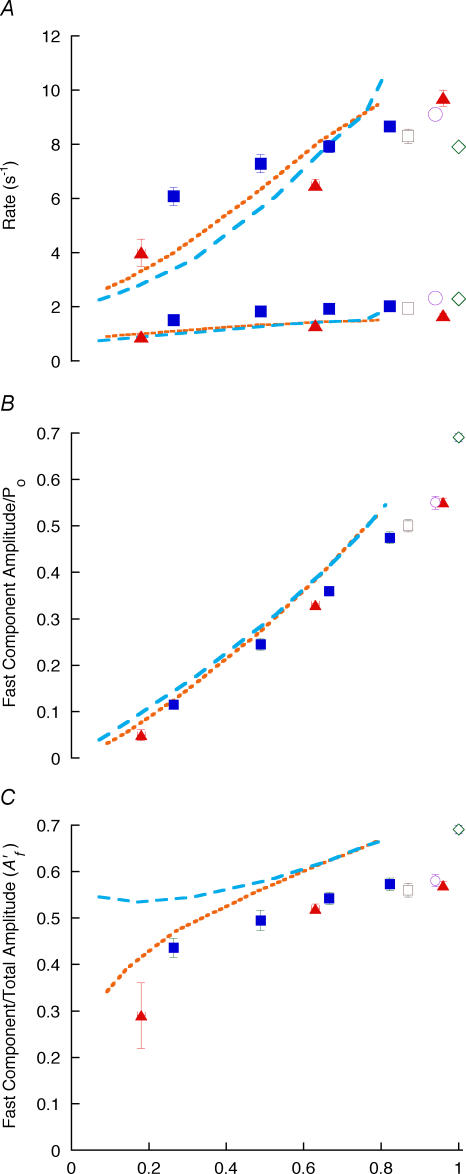
Figure 11. Dependence on amplitude of recovery of amplitude and rate of exponentials fitted to model data.
Model recovery records from shortening steps and ramps of varying amplitude were fitted with two exponentials. A, plot of fast and slow component rate constants versus amplitude of recovery from steps (dashed line) and ramps (dotted line). B, plot of fast component amplitude versus amplitude of recovery for steps (dashed line) and ramps (dotted line). C, plot of fractional amplitude of fast component versus amplitude of recovery for steps (dashed line) and ramps (dotted line). Corresponding points from experimental data are included for comparison (from Fig. 4).

