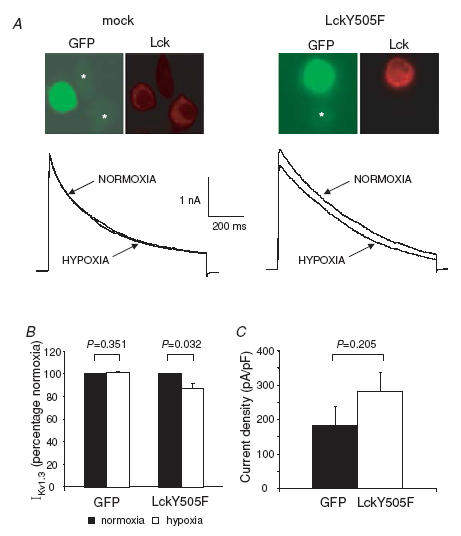
Figure 7. Effect of constitutively active Lck on recombinant Kv1.3 current amplitude and O2 sensitivity.

A, top panels show representative fluorescence images of rat L929 cells transiently transfected with pIRES2-EGFP empty vector (mock) and with pIRES2-EGFP vector containing constitutively active Lck (LckY505F). Non-transfected cells are marked with an asterisk in the GFP panels. In the mock experiments the intensity of red fluorescence, indicative of Lck levels, is identical in transfected and non-transfected cells. A 10-fold increase in Lck levels was instead observed in the LckY505F transfected cells. Representative Kv1.3 current traces recorded in LckY505F and mock transfected L929 cells in normoxia and after 3 min in hypoxia are shown in the bottom panels. Currents were elicited as described in the legend of Fig. 6. B, averaged effect of hypoxia on Kv1.3 currents in LckY505F and mock transfected cells. Data are expressed as a percentage of control (normoxia). C, current density in LckY505F (n = 15) and mock (n = 11) cells.
