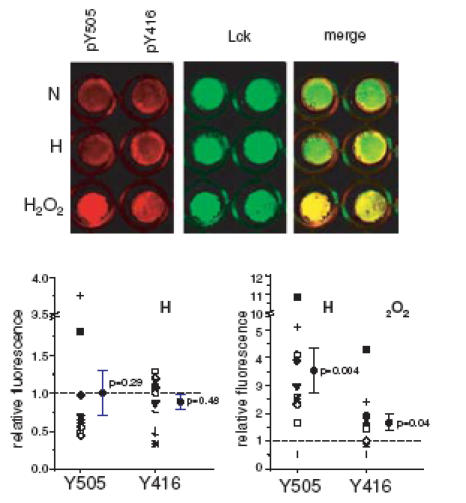
Figure 9. Effect of acute hypoxia on Lck activity.

Near-infrared cytoblot assay of phosphorylated Y505 Lck and active Lck (pY396Lck, detected using anti-phosho-src family pY416 antibodies) in normoxia (N), after 3 min exposure to hypoxia (H, 20 mmHg) and after 15 min treatment with 2 mm H2O2. Red pseudocolour images represent the 700 nm wavelength signal of pY505 and pY416 phosphospecific antibodies, while the green pseudocolour images represent the 800 nm wavelength signal of anti-Lck antibody. The right images show the merged picture of red and green images. The lower panels show the averages (with the corresponding P-values) and the individual levels of pY505 and pY416 after 3 min hypoxia (H, left) and after 15 min treatment with H2O2 (right) in 11 donors. Note the different Y axes for the two graphs. The actual values were obtained by normalizing the phosphospecific signals to the signal of Lck in double labelled cells. The values are expressed as relative to normoxia (set as 1 and marked by a dashed line). The symbols indicating each donor are the same in the two graphs.
