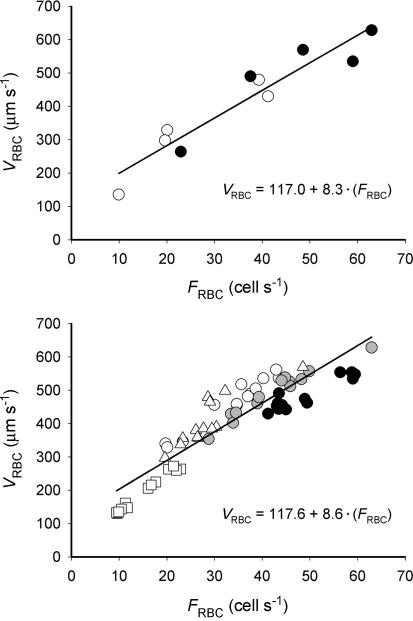
Figure 7.
Mean capillary red blood cell velocity (VRBC) and flux (FRBC) during recovery from muscle contractions (from 1 to 180 s). Upper panel shows the steady-state relationship (•, end-contraction; ○, end-recovery) for each animal. Lower panel depicts the dynamic association between VRBC and FRBC from end-contraction to end-recovery. Symbols represent each individual muscle studied. For both panels the continuous line denotes the linear regression.

