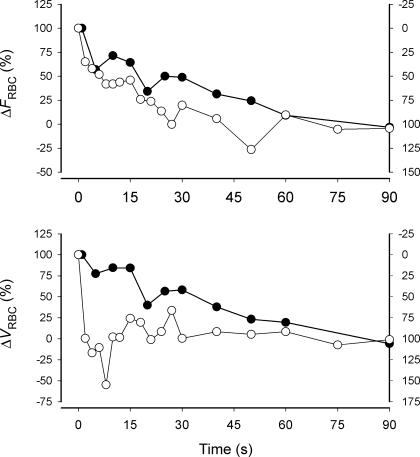
Figure 8.
Changes (Δ) in FRBC and VRBC after the onset (○; right y-axis) and end of muscle contractions (•; left y-axis). The data are normalized for the amplitude of the response at 90 s (percentage change) and the right y-axes are modified to produce a ‘mirror image’ of the onset of contractions (Kindig et al. 2002) as for Fig. 1.

