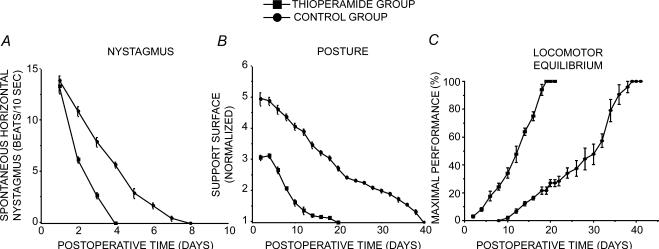
Figure 5. Effects of thioperamide treatment on horizontal spontaneous nystagmus (HSN), posture function, locomotor balance recovery.
For all the behavioural data, the thioperamide group is shown as filled squares and the control group as filled circles. A measurement of horizontal spontaneous nystagmus (HSN) after unilateral vestibular neurectomy as an index of vestibular compensation. Time course of disappearance of HSN frequency after UVN. Each data point represents the mean number of HSN quick-phase movements in 10 s across 3 animals (five repeated measures per animal per sampling). Error bars represent s.e.m. Note the strong increase in HSN 2 days after unilateral vestibular neurectomy and the faster recovery under thioperamide treatment. B, mean postoperative development of the support surface in the two groups of cats. The support surface evaluated in cm2 and normalized with respect to the preoperative values referred to unity (1 being close to 50 cm2), is reported on the ordinate as a function of the postoperative time in days on the abscissae. Each point represents the mean value (n = 5 measurements per cat) calculated in the treated (N = 4) and untreated (N = 4) groups of cats. Standard errors of the mean are reported as vertical lines. Note the strong increase in support surface in the days following unilateral vestibular neuretomy and the faster recovery under thioperamide treatment. C, mean recovery curves illustrating maximal performance of the cat on the rotating beam, expressed as a percentage of the preoperative maximal performance (on the ordinates) as a function of the postoperative time in days (on the abscissa). Standard errors of the mean are reported as vertical lines. The linear regression curves fitting the experimental data are plotted on each graph. Note the acceleration of the recovery time under thioperamide treatment as compared to the controls, illustrated both by the slope of the regression curves and by the shorter time required to achieve full compensation (3 weeks instead of almost 6 weeks).

