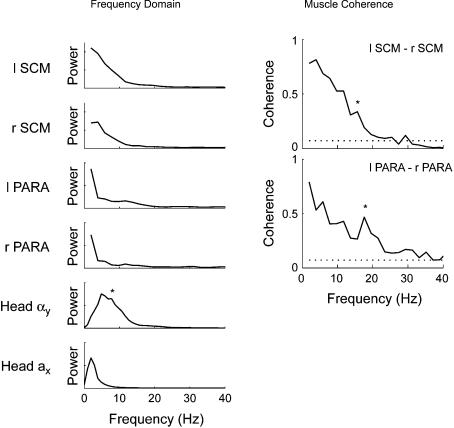
Figure 3. Power and coherence of muscle and kinematic data recorded during a single 4 km h−1 rear-end collision (experiment 1).
Left panel, average power spectra for the left and right SCM muscles, left and right PARA muscles, head forward acceleration (Head ax) and head angular acceleration (Head αy). * denotes the secondary peak in the power of the head angular acceleration signal between 5 and 10 Hz. Right panel, average coherence between the left and right SCM and PARA muscles. The dotted lines represents the 95% confidence limit for the coherence estimates. Note the significant peaks in coherence at 15.6 Hz (SCM) and 17.6 Hz (PARA) depicted by * and the power associated with these increases in the averaged power spectra (left panel).

