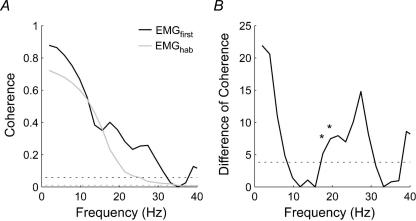
Figure 4. Coherence between the left and right SCM muscles recorded during exposure to 1.8 km h−1 forward perturbations (experiment 2).
A, average coherence between the left and right SCM muscles for the first perturbation (EMGfirst; black line) and the habituated trials (EMGhab; grey line). The two dotted lines represents the 95% confidence limit for the coherence estimates (black line: EMGfirst; gray line: EMGhab). B, distribution of the difference of coherence test between the first and habituated trials for all frequencies. The dotted line indicates the P = 0.05 threshold for a χ2 distribution with 1 degree of freedom. Note the significant difference (depicted by *) in coherence at ∼17 Hz and ∼19 Hz associated with a secondary peak in coherence present in the first trial but absent in the habituated trials.

