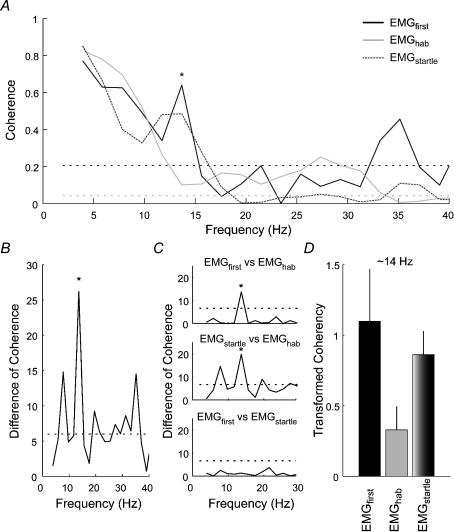
Figure 5. Coherence between the left and right SCM muscles recorded during exposure to 1.8 km h−1 forward perturbations (experiment 3).
A, estimated averaged coherence between the left and right SCM muscles for the first perturbation (EMGfirst; black line), habituated perturbations (EMGhab; grey line) and combined perturbation and acoustic startle (EMGstartle; dotted dark grey line). The horizontal dotted lines represents the 95% confidence limit for the coherence estimates (black line: EMGfirst; grey line: EMGhab and EMGstartle). B, distribution of the omnibus DoC test between the EMGfirst; EMGhab and EMGstartle conditions for all frequencies. The dotted line indicates the P = 0.05 threshold for a χ2 distribution with 2 degrees of freedom. C, distribution of the pair-wise post hoc DoC tests for the frequencies between 0 and 30 Hz. The dotted line indicates the P = 0.01 threshold for a χ2 distribution with 1 degree of freedom. D, bar graphs showing the transformed coherency (tanh−1) at the ∼14 Hz frequency for the various conditions. Note the significant difference (depicted by * in panels A, B and C) in coherence at ∼14 Hz associated with a peak in coherence for the EMGfirst and EMGstartle conditions and reduction in coherence for the habituated postural responses.

