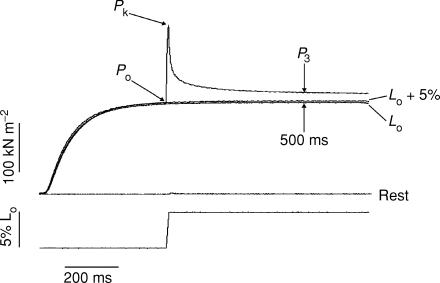
Figure 1. Time course of tension rise in response to a ramp stretch.
Sample recordings from one preparation illustrating the tension response (upper trace) to a ramp stretch (lower trace) at 10 L0 s−1 applied on the plateau of a tetanic contraction. Also shown are the tension recordings during isometric tetanic contractions at L0 and the extended length (L0+ 5%) as well as the tension response to a ramp stretch applied at rest.

