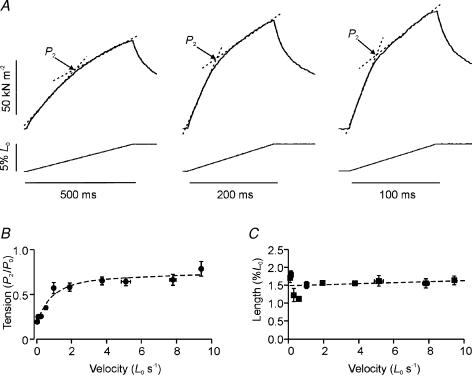
Figure 2. Tension response to slow stretches.
A, three tension responses (upper traces) to 5% ramp stretches (lower traces) at slow velocities of 0.1 (left), 0.25 (middle) and 0.5 L0 s−1 (right). The tension rise shows a change in slope (labelled P2). The P2 tension was measured as shown. B, dependence on stretch velocity of P2 tension (normalized to P0, curve fitted by eye). Pooled data are shown from seven bundles. C, dependence on stretch velocity of the stretch amplitude at P2 (L2) from the same bundles.

