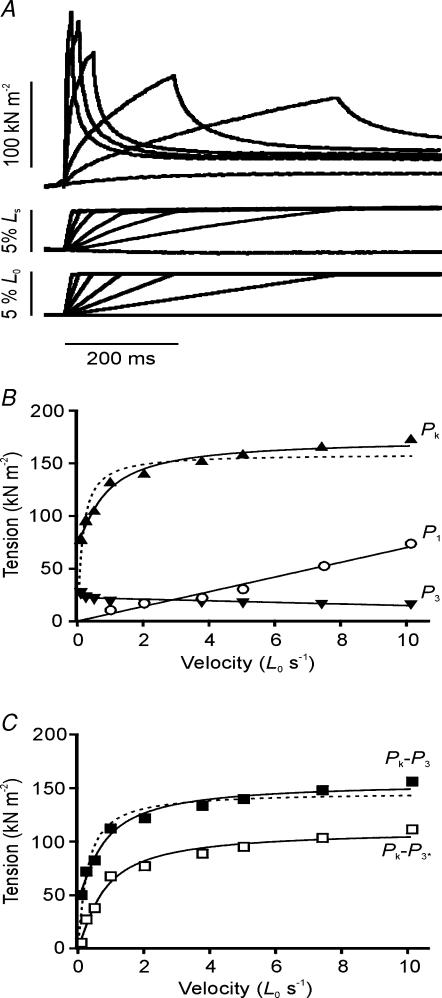
Figure 5. Velocity dependence of the tension responses.
A, the tension responses (upper traces) to ramp stretches (lower traces) at a range of velocities (0.1–4.0 L0 s−1) from one bundle are shown; middle traces show displacement of a marker placed on the surface of the fibre bundle (segment length responses). The rate of tension development and the rate of tension decay increased with stretch velocity; the tension decayed to a similar level (P3 above the isometric tension, the lowest tension record) when measured 500 ms after the end of the ramp. Note, the tension trace at the slowest stretch velocity has been truncated before reaching this point. B, velocity dependence of Pk (▴), P3 (▾) and P1 (○) from one fibre bundle. The Pk tension increased with velocity towards a plateau, P3 was relatively insensitive to velocity and P1 increased in proportion to velocity with a slope of 6.97 kN m−2 per L0 s−1. The dashed line represents the curve fit to Pk using eqn (1) in the text. A better fit (continuous line) was obtained using eqn (2), where Vc= 1.46 L0 s−1, PL= 100 kN m−2, and P3*= 73.45 kN m−2. In this example, P3* is approximately fivefold greater than the measured P3 tension. C, velocity dependence of Pk−P3 (▪) and Pk−P3* (□). For Pk−P3 data, the dashed curve represents the fit of eqn (1) and the continuous curve of eqn (2), where Vc= 1.30 L0 s−1, PL= 111 kN m−2, and P3*= 44.71 kN m−2. Note that Pk−P3* data and the fitted curve (pure viscoelastic equation, eqn (2) with P3*= 0) characterize the velocity dependence of force in the crossbridge component only. Note the intercept on the Pk axis (Fig. 5B) is P3* and on the Pk−P3 axis (Fig. 5C) is P3*−P3.

