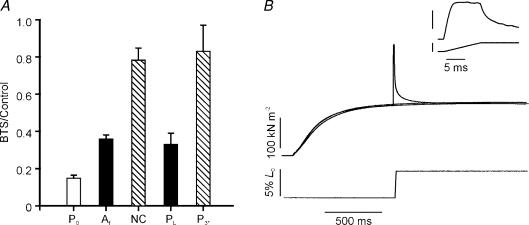
Figure 7. Examination of non-crossbridge component.
A, effects of BTS on tension contribution by the two components. Bars represent the mean (±s.e.m.) BTS/control tension ratios from 4 fibre bundles. The ratio for isometric tetanic tension P0 is shown by the open column. The ratios for PL and P3* are from analyses of the peak tension versus velocity data and amplitude of fast (Af) and amplitude of slow plus P3 (labelled NC) from analysis of the tension relaxation. Note that, with either analysis, the non-crossbridge contribution (hatched columns) is much less depressed than the crossbridge contribution (filled columns). B, absence of residual force enhancement after stretch in a slow muscle. Tension response (upper trace) to a ramp stretch at 5 L0 s−1 (lower trace) on a small bundle of soleus muscle fibres. Also shown are the isometric tetanic contractions at L0 and the extended length (L0+ 5%). The inset shows the tension response to the stretch at a higher resolution. Note that the residual tension (P3) and the tension rise after the P2 transition are absent.

