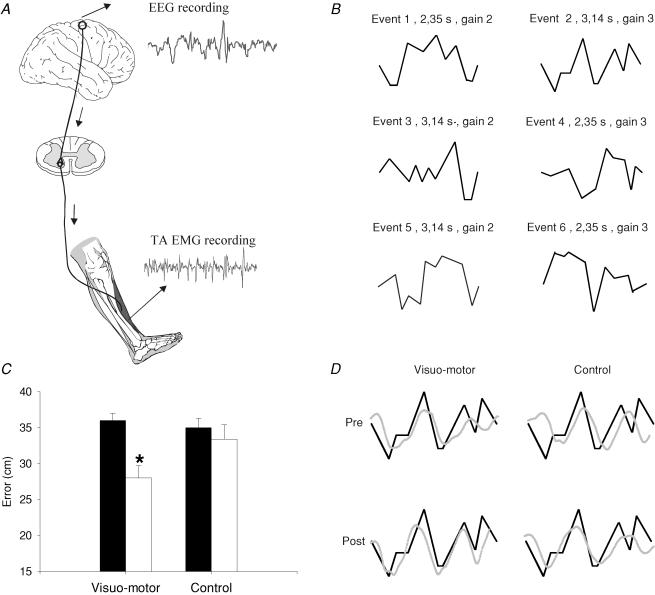
Figure 1. Effect of visuo-motor skill training and a control session on motor performance.
A, experimental set-up. Electroencephalographic (EEG) activity was recorded from the scalp over the leg area of the motor cortex. Electromyographic (EMG) activity was recorded by surface electrodes over the tibialis anterior muscle (TA). Coherence and cumulant density functions were calculated for paired EEG–EMG and EMG–EMG recordings during tonic dorsiflexion before and after the visuo-motor skill training and control session. B, the six randomized figures presented during the visuo-motor skill training session. Event no. 2 was used to assess motor performance before and after each training session. C, bar graph demonstrating the average motor performance before and after visuo-motor skill and control session (n = 7). The ordinate shows the mean error value from all subjects (cm). The abscissa shows the time at which measurements were taken (before, filled bar and after, open bar). Error bars indicate standard errors of the mean (*P < 0.05). D, traces showing the event selected for analysis (thick line) and the subject performance (thin line). Each thin line represents the average of the subject performance for 4 min. The traces shown are from a single subject.

