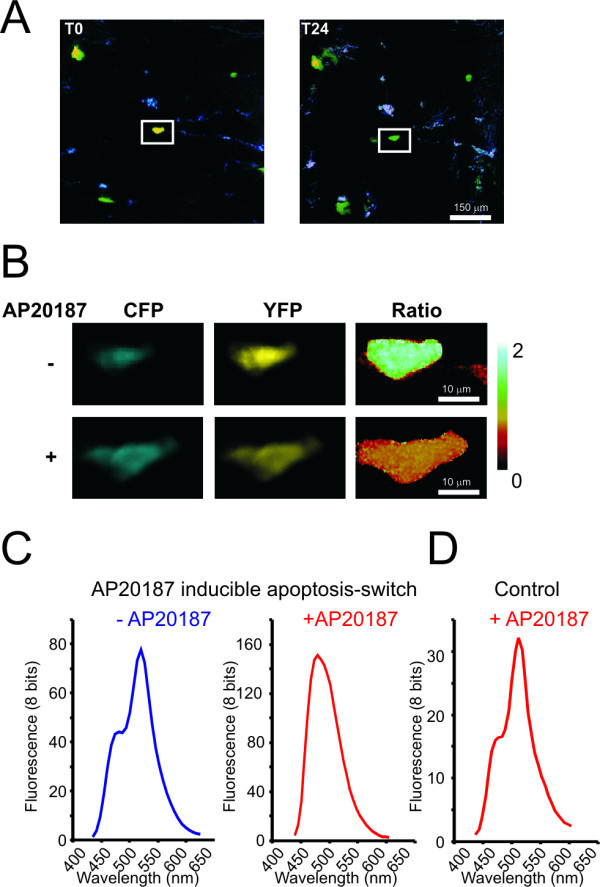
Figure 5.

Visualizing apoptosis in the skin of a living mouse by FRET. A) An AP20187 sensitive 'apoptosis-switch' and FRET-based 'apoptosis-sensor' were tattooed on the skin of living mouse. Apoptosis was induced by injection of the chemical inducer of dimerization AP20187 in the peritoneal cavity of the mouse. Images were taken by confocal microscopy before and 24 hours after injection. Cells were identified by image registration at multiple time points as described in the text and supplementary data. A representative cell is boxed. Shown are merged images of the tdtomato, YFP and autofluorescence. B) CFP and YFP images of the cell as boxed in A imaged at higher resolution. Note the loss in FRET as a consequence of apoptosis induction. C) Emission spectrum of the cell boxed in A before injection of AP20187 (left, blue spectrum) and 24 hours after injection (right, red spectrum). D) Spectrum of a cell in the same animal as in C, double transfected with a control construct plus the FRET based apoptosis-sensor 24 hours after injection of AP20187.
