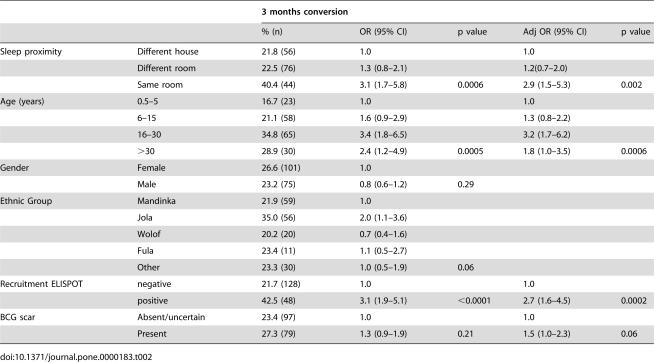
Table 2. Evaluation of possible factors associated with tuberculin test conversion at 3 months in 704 TB case contacts.
| 3 months conversion | ||||||
| % (n) | OR (95% CI) | p value | Adj OR (95% CI) | p value | ||
| Sleep proximity | Different house | 21.8 (56) | 1.0 | 1.0 | ||
| Different room | 22.5 (76) | 1.3 (0.8–2.1) | 1.2(0.7–2.0) | |||
| Same room | 40.4 (44) | 3.1 (1.7–5.8) | 0.0006 | 2.9 (1.5–5.3) | 0.002 | |
| Age (years) | 0.5–5 | 16.7 (23) | 1.0 | 1.0 | ||
| 6–15 | 21.1 (58) | 1.6 (0.9–2.9) | 1.3 (0.8–2.2) | |||
| 16–30 | 34.8 (65) | 3.4 (1.8–6.5) | 3.2 (1.7–6.2) | |||
| >30 | 28.9 (30) | 2.4 (1.2–4.9) | 0.0005 | 1.8 (1.0–3.5) | 0.0006 | |
| Gender | Female | 26.6 (101) | 1.0 | |||
| Male | 23.2 (75) | 0.8 (0.6–1.2) | 0.29 | |||
| Ethnic Group | Mandinka | 21.9 (59) | 1.0 | |||
| Jola | 35.0 (56) | 2.0 (1.1–3.6) | ||||
| Wolof | 20.2 (20) | 0.7 (0.4–1.6) | ||||
| Fula | 23.4 (11) | 1.1 (0.5–2.7) | ||||
| Other | 23.3 (30) | 1.0 (0.5–1.9) | 0.06 | |||
| Recruitment ELISPOT | negative | 21.7 (128) | 1.0 | 1.0 | ||
| positive | 42.5 (48) | 3.1 (1.9–5.1) | <0.0001 | 2.7 (1.6–4.5) | 0.0002 | |
| BCG scar | Absent/uncertain | 23.4 (97) | 1.0 | 1.0 | ||
| Present | 27.3 (79) | 1.3 (0.9–1.9) | 0.21 | 1.5 (1.0–2.3) | 0.06 | |

