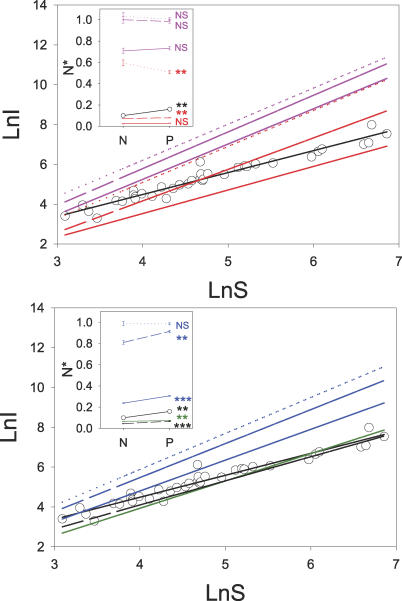
Figure 3. Relationship between Network C and N* for Real-World and Modelled Data Matrices.
Insets show the N* (average ± SE) of highly and lowly connected communities (i.e., those with positive and negative residuals in the fits of the number of interactions on species richness displayed in the larger panels). Narrow-range complementarity models are red, broad-range complementarity models are magenta, barrier models are blue, and mixed models are green. Dotted lines indicate one-trait models, broken lines indicate two-trait models, and continuous lines indicate four-trait models. Circles indicate real-world data (N = 37), the continuous black line indicates an empirical fit to real-world data, and the broken black line is the result of lognormal-neutral models. Asterisks indicate significant differences between highly and lowly connected categories (i.e., those with positive and negative residuals, respectively). *p < 0.05, **p < 0.01, ***p < 0.001, NS p > 0.05.

