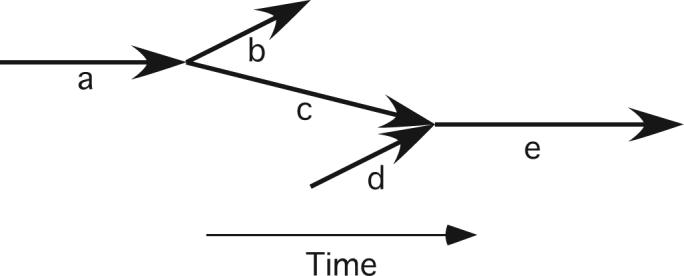
Figure 2.

A simple wavefront graph. Each bold arrow represents a wavefront. The horizontal positions of a wavefront's endpoints locate the wavefront in time. The vertical positions are not significant. There are two wavefront contact events: wavefront a fragments into wavefronts b and c and wavefronts c and d collide and coalesce to form wavefront e.
