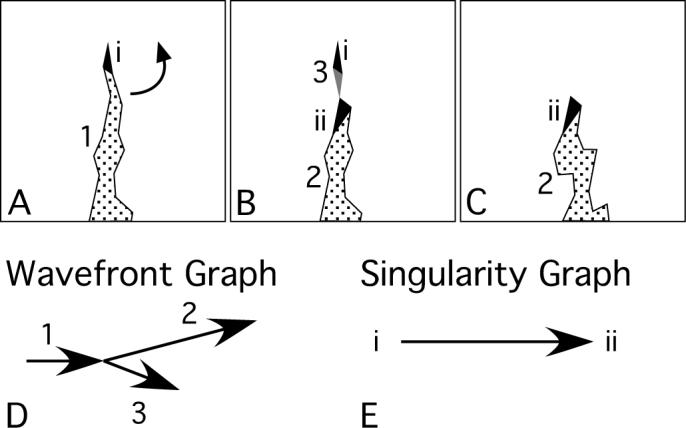
Figure 3.

A compound rotor with two sequential phase singularities. In panels A-C, the black and gray triangles are PSs of opposite chirality and the stippled regions are wavefronts. The arrow in A indicates the direction of rotation about the PS. Panel D is the wavefront graph of the activation pattern in A-C. Panel E is the singularity graph of the black PSs.
